The status of Vietnam's goods exports and imports in January 2023.
1. General Assessment
In January 2023, due to the extended holidays of the Gregorian New Year and the Lunar New Year (Tet), the total value of merchandise imports and exports across the country reached $46.56 billion, a 17.3% decrease compared to December 2022. Among these figures, the export value was $23.61 billion, down 18.7% (equivalent to a $5.42 billion decrease), and the import value was $22.95 billion, down 15.9% (equivalent to a $4.34 billion decrease). The trade balance for goods in January 2023 achieved a surplus of $656 million.
Compared to January 2022, the total value of merchandise imports and exports across the country decreased by 25%. Exports decreased by 25.9%, equivalent to an $8.25 billion reduction, and imports decreased by 24%, equivalent to a $7.27 billion decrease.
The General Department of Customs noted that the total value of imports and exports by foreign direct investment (FDI) enterprises in the month reached $33.5 billion, down 11.9% compared to the previous month and down 22.1% compared to the same period last year. Specifically, exports amounted to $17.97 billion, down 14.2% compared to the previous month and down 21.5% compared to the same period last year, while imports were $15.53 billion, down 9.2% compared to the previous month and down 22.8% compared to the same period last year.
Calculations by the General Department of Customs show that the trade balance for goods of FDI businesses in January 2023 had a surplus value of $2.44 billion.
2.Import-Export Markets
In the first month of 2023, Vietnam's commodity trade with Asia reached $30.65 billion, a 21.9% decrease compared to January 2022, continuing to account for the highest share (65.8%) in the total value of merchandise imports and exports across the country.
The value of exports and imports between Vietnam and other continents were as follows: Americas: $9.1 billion, down 33.1%; Europe: $5.31 billion, down 26.6%; Oceania: $1.05 billion, down 19.2%; and Africa: $462 million, down 32.1% compared to January 2022.
Table 1: Value of exports and imports by continent, economic bloc, and some major markets in January 2023 and compared to January 2022.
|
Major market |
Exports |
Imports |
||||
|
Value (Billion USD) |
Comparing to T01/2022 (%) |
Density (%) |
Value (Billion USD) |
Comparing to T01/2022 (%) |
Density (%) |
|
|
Asia |
11,48 |
-17,2 |
48,6 |
19,16 |
-24,5 |
83,5 |
|
- ASEAN |
2,17 |
-21,9 |
9,2 |
3,02 |
-14,2 |
13,2 |
|
- China |
3,87 |
-0,1 |
16,4 |
7,23 |
-34,7 |
31,5 |
|
- Korea |
1,69 |
-16,2 |
7,2 |
3,91 |
-24,7 |
17,0 |
|
- Japan |
1,54 |
-24,3 |
6,5 |
1,68 |
-3,9 |
7,3 |
|
North America |
7,40 |
-36,6 |
31,3 |
1,70 |
-12,0 |
7,4 |
|
-U.S.A |
6,15 |
-38,9 |
26,1 |
0,92 |
-13,6 |
4,0 |
|
Europe |
4,06 |
-26,0 |
17,2 |
1,25 |
-28,5 |
5,5 |
|
- EU(27) |
3,28 |
-25,3 |
13,9 |
1,02 |
-18,6 |
4,4 |
|
Oceania |
0,48 |
-4,5 |
2,0 |
0,57 |
-28,6 |
2,5 |
|
Africa |
0,18 |
-42,7 |
0,8 |
0,28 |
-22,7 |
1,2 |
|
Total |
23,61 |
-25,9 |
100,0 |
22,95 |
-24,0 |
100,0 |
Sources: Tổng cục Hải quan
3. Export of Goods
The export of goods in January 2023 reached $23.61 billion, a decrease of 18.7% compared to December 2022, which is equivalent to a $5.42 billion decrease. Compared to January 2022, this represented a 25.9% decline, or an $8.25 billion decrease.
In January, only two categories of goods, namely various types of phones and phone components, saw an increase in exports compared to the previous month, with a growth rate of 61.7%, equivalent to a $1.92 billion increase. Exports of glass and glass products increased by 7.4%. On the other hand, the export of computer equipment, electronic products, and components experienced the most significant decrease at 33.7%, corresponding to a $1.62 billion reduction. Machinery, equipment, tools, and accessories decreased by $826 million, textiles and garments by $650 million, wood and wood products by $503 million, footwear by $484 million, and seafood by $279 million.
Chart 1: Value and proportion of exports for some major product groups in January 2023.

Nguồn: Tổng cục Hải quan
3. Some Key Export Categories
a. Various Types of Phones and Components: The export value of this category in January 2022 was $5.02 billion, an increase of 61.7% compared to the previous month and a 2.1% increase compared to the same period in the previous year.
- Exports to China reached $1.7 billion, a significant increase of 77.3%.
- Exports to the United States were $658 million, a decrease of 46.8%.
- Exports to South Korea were $288 million, a decrease of 13.1% compared to the same period in 2022.
b. Computers, Electronic Products, and Components: The export value of this category in January reached $3.17 billion, a 33.7% decrease compared to the previous month and a 24.2% decrease compared to the same period in the previous year.
- Exports of computers, electronic products, and components to the United States in the first month of 2023 reached $1.03 billion, an increase of 3.7% compared to January of the previous year.
- Exports to the Chinese market reached $499 million, a 31.8% decrease.
- Exports to South Korea were $353 million, a decrease of 1.5%.
- Exports to Hong Kong were $317 million, a decrease of 25.3%.
c. Other Machinery, Equipment, Tools, and Accessories: Exports of this category in January reached $2.9 billion, a 22.2% decrease compared to the previous month and a 22.5% decrease compared to the same period in the previous year.
- Main importing markets for machinery, equipment, tools, and accessories in January 2023 included the United States with $1.25 billion, a decrease of 27.2%.
- South Korea with $197 million, a decrease of 16.4%.
- Japan with $192 million, a decrease of 24.6% compared to January 2022.
d. Textiles and Garments: The export of textiles and garments in January reached $2.25 billion, a 22.4% decrease compared to the previous month and a 37.6% decrease compared to the same period in the previous year.
- In January 2023, the United States continued to be the largest market for textile and garment imports from Vietnam, with a value of $992 million, a 46.7% decrease compared to the same period in the previous year.
- The EU(27) market consumed $297 million, a decrease of 22.8%.
- Japan consumed $249 million, a decrease of 16.5%.
4. Import of Goods
The import value in January 2023 was $22.95 billion, a 15.9% decrease compared to December 2022, which is equivalent to a $4.34 billion decrease. Compared to January 2022, this represents a 24% decrease, or a $7.27 billion decrease.
- Imports of computers, electronic products, and components increased by $776 million, while petroleum products increased by $89 million compared to the previous month.
- On the other hand, imports of machinery, equipment, tools, and accessories decreased by $798 million, imports of various types of phones and components decreased by $618 million, imports of iron and steel decreased by $285 million, and pharmaceuticals decreased by $263 million.
Chart 2: Value and proportion of imports for some major product groups in January 2022.

Nguồn: Tổng cục Hải quan
3. Some Key Import Categories
a. Computers, Electronic Products, and Components: The import value of this category in January 2023 was $6.56 billion, a 13.4% increase, equivalent to $776 million, compared to the previous month. However, compared to the same period in 2022, the import of this category decreased by 11%, equivalent to a $810 million decrease.
- Imports from the South Korean market amounted to $2.11 billion, an increase of 5.3% (equivalent to an increase of $105 million).
- Imports from China were $1.5 billion, a decrease of 36.7% (equivalent to a decrease of $872 million).
- Imports from Taiwan were $853 million, a decrease of 21.8% (equivalent to a decrease of $238 million).
- Imports from Japan were $708 million, an increase of 36.1% (equivalent to an increase of $188 million).
b. Other Machinery, Equipment, Tools, and Accessories: The import value of this category in January was $2.74 billion, a 22.6% decrease compared to the previous month and a 33.1% decrease compared to January 2022.
- In January 2023, imports of this category of goods to Vietnam originated mainly from China, amounting to $1.41 billion, a 38.9% decrease.
- Imports from South Korea were $395 million, a 24.9% decrease.
- Imports from Japan were $264 million, a 19% decrease compared to January 2022.
c. Various Types of Petroleum Products: In January 2023, the quantity of various petroleum products imported reached 1.03 million metric tons, with a total value of $911 million, representing an 8.6% increase in quantity and a 10.8% increase in value compared to the previous month. Compared to January 2022, imports had increased by 69.8% in quantity and 99.7% in value.
- Compared to January 2022, imports of various petroleum products into Vietnam saw significant increases in two primary markets, South Korea and Singapore. Specifically, imports from South Korea were 369,000 metric tons, a three-fold increase, while imports from Singapore were 243,000 metric tons, a 2.5-fold increase. Additionally, imports from Malaysia were 220,000 metric tons, a 28.5% increase, while imports from Thailand were 83,000 metric tons, an 18.4% decrease.
d. Raw Materials Serving the Textile, Leather, and Footwear Industries (including cotton, textile fibers, various types of fabric, and raw materials for textiles, clothing, leather, and footwear): The import value of this category in January 2023 reached $1.62 billion, a 14.6% decrease compared to the previous month and a 35.7% decrease compared to the same period in the previous year.
Chart 3: Import value of raw materials serving the textile, leather, and footwear industries to Vietnam in January 2022 and January 2023.

Raw materials serving the textile, leather, and footwear industries imported into Vietnam in January 2023 mostly originated from China, accounting for a significant 51% share, with a total value of $903 million. This marked a 36.6% decrease compared to January 2022.
Whole Automobiles of All Kinds: The number of whole automobiles registered for customs declaration upon import in January 2023 reached 14,457 vehicles, representing a 34% decrease compared to the previous month. Of these, vehicles with nine seats or less accounted for 91% of the total number of whole automobiles of all kinds imported into Vietnam.
Compared to January 2022, the number of whole automobiles registered for import into Vietnam increased by 9,924 vehicles, with a corresponding increase in value of 148.9%, equivalent to $188 million.
In January 2023, whole automobiles of all kinds mainly originated from Thailand, Indonesia, and the United States. Specifically, imports from Thailand amounted to 6,693 vehicles, an increase of 157.9%; imports from Indonesia reached 6,179 vehicles, a 12.5-fold increase, and imports from the United States totaled 432 vehicles, a 33-fold increase compared to January 2022.
|
CUSTOMS STATISTICS OVERVIEW |
||||||||||||||||||||||||||||||||||||||||||||||||||||||||||||||||
|
EXPORT AND IMPORT OF GOODS IN JANUARY 2023
|
||||||||||||||||||||||||||||||||||||||||||||||||||||||||||||||||
|
Sources: Tổng cục Hải quan |
||||||||||||||||||||||||||||||||||||||||||||||||||||||||||||||||
The analysis of Vietnam's merchandise export and import situation for February 2023 is expected to be released on March 10, 2023.
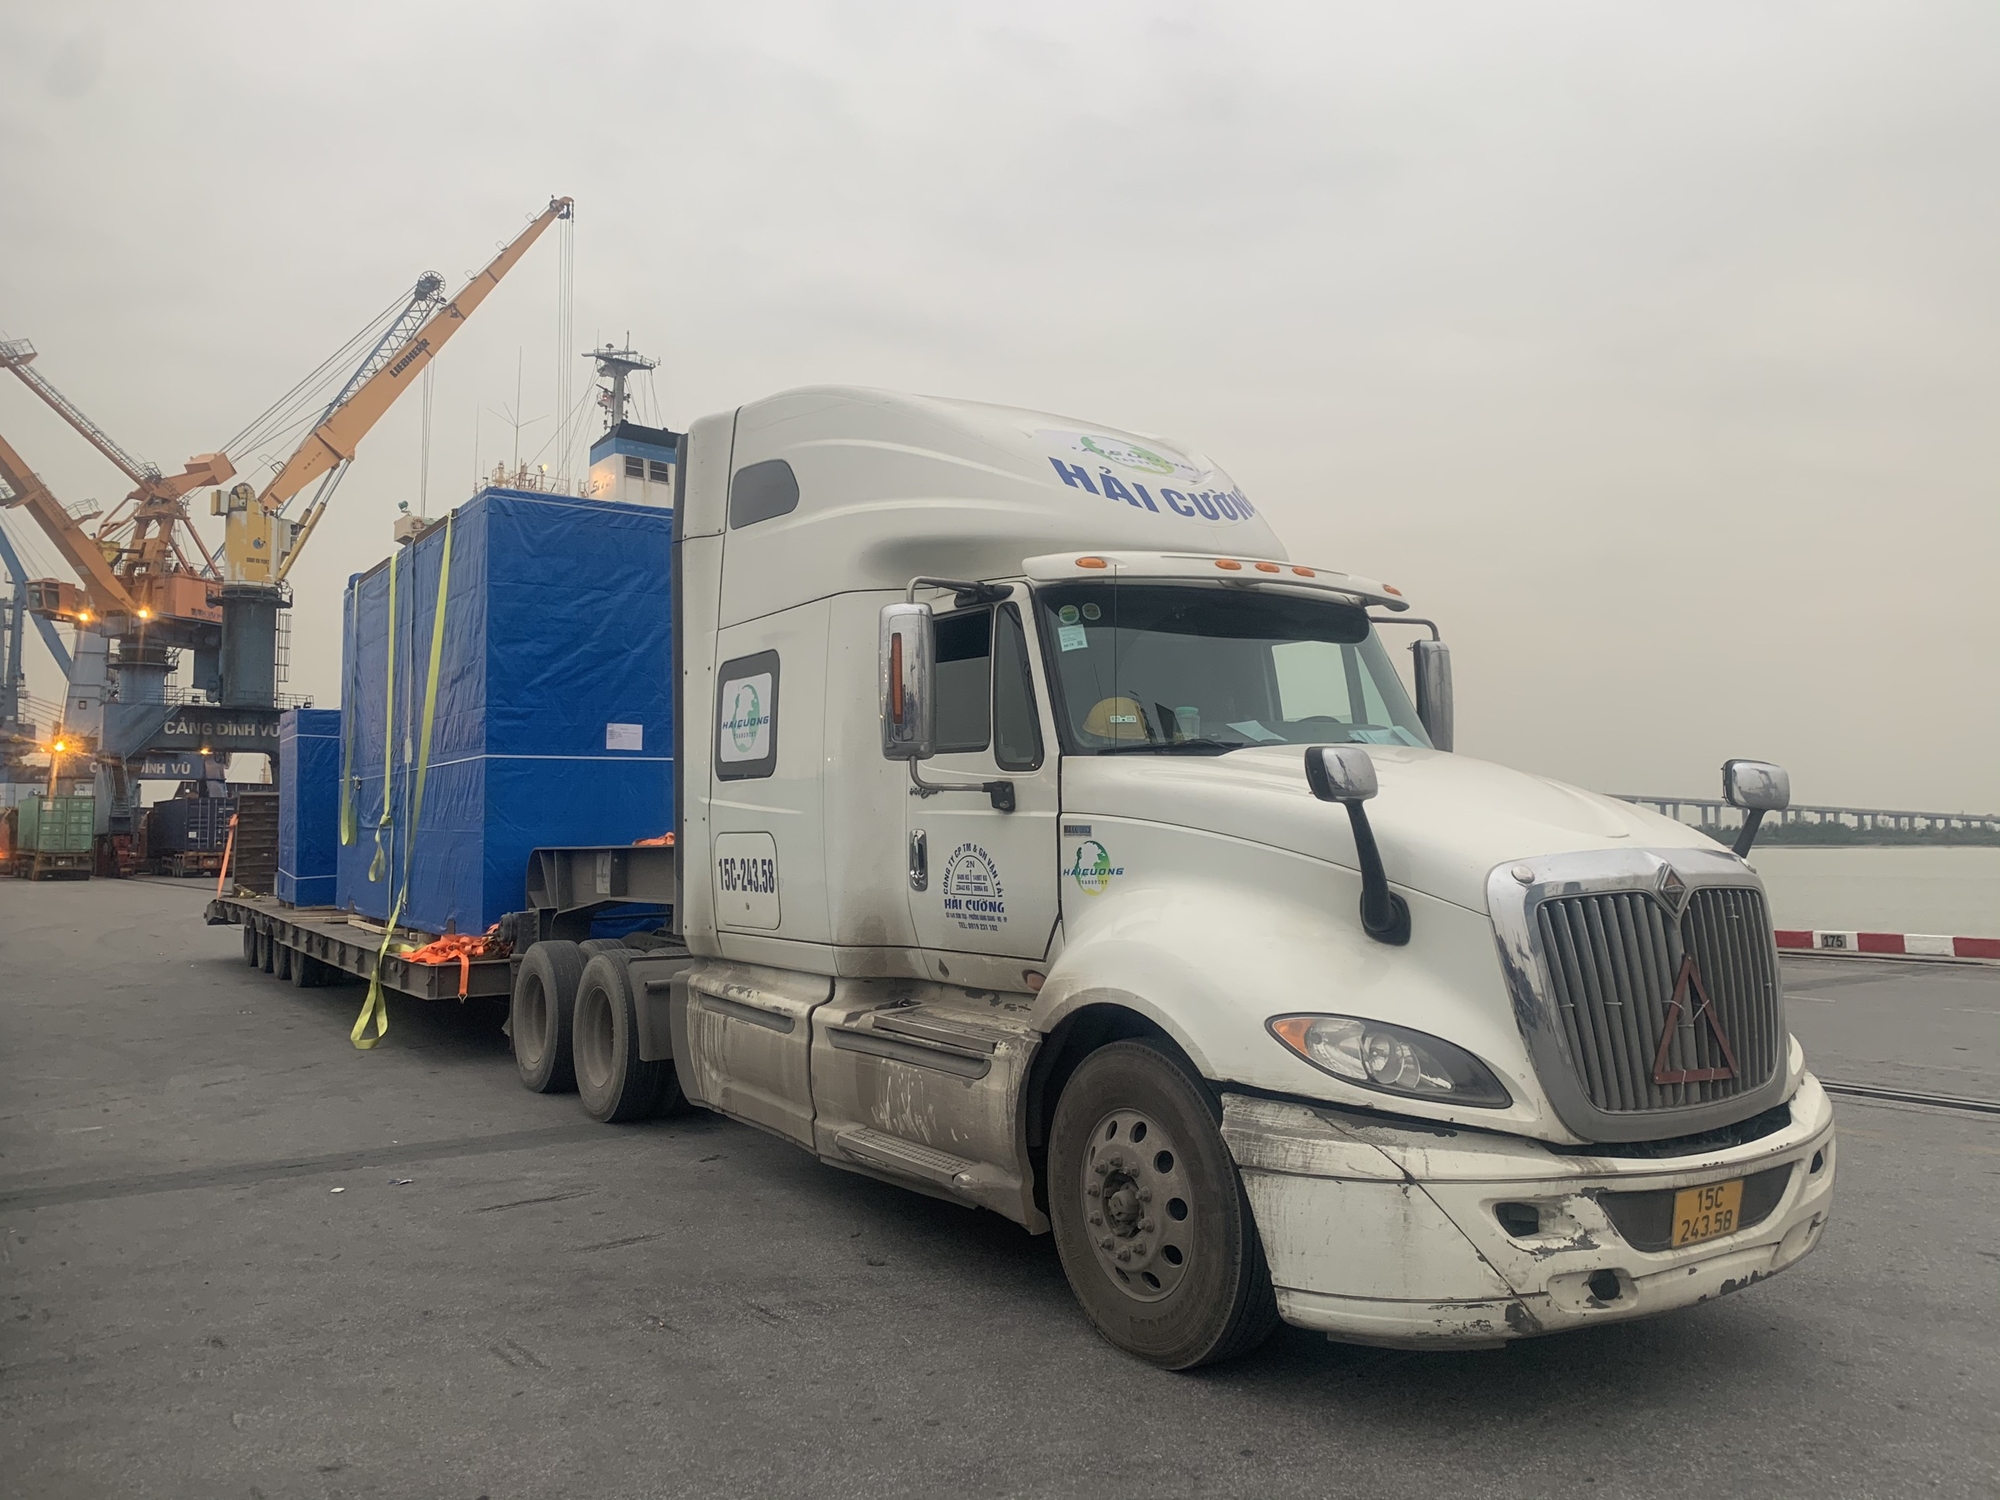
In the era of Industrialization and Modernization, with the development of Industrial Economy, the issue of transporting large-volume goods has become a significant concern for many businesses, especially in the context of services related to the transportation of oversized and overloaded cargo. Bulky and heavy goods that cannot be disassembled may lead to potential violations of the regulations in the field of oversized and overloaded cargo transportation.
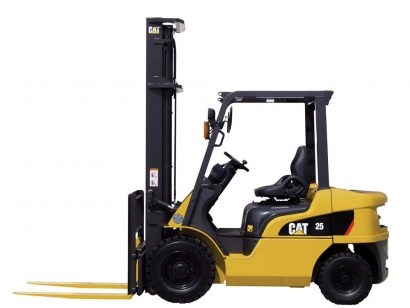
Thủ tục nhập khẩu xe nâng, thuế nhập khẩu xe nâng, mã hs xe nâng cho các loại xe nâng điện, xe nâng dầu, xe nâng mới, xe nâng đã qua sử dụng và quy trình kiểm tra chất lượng. Là những nội dung chính mà Hải Cường team muốn chia sẻ đến quý vị
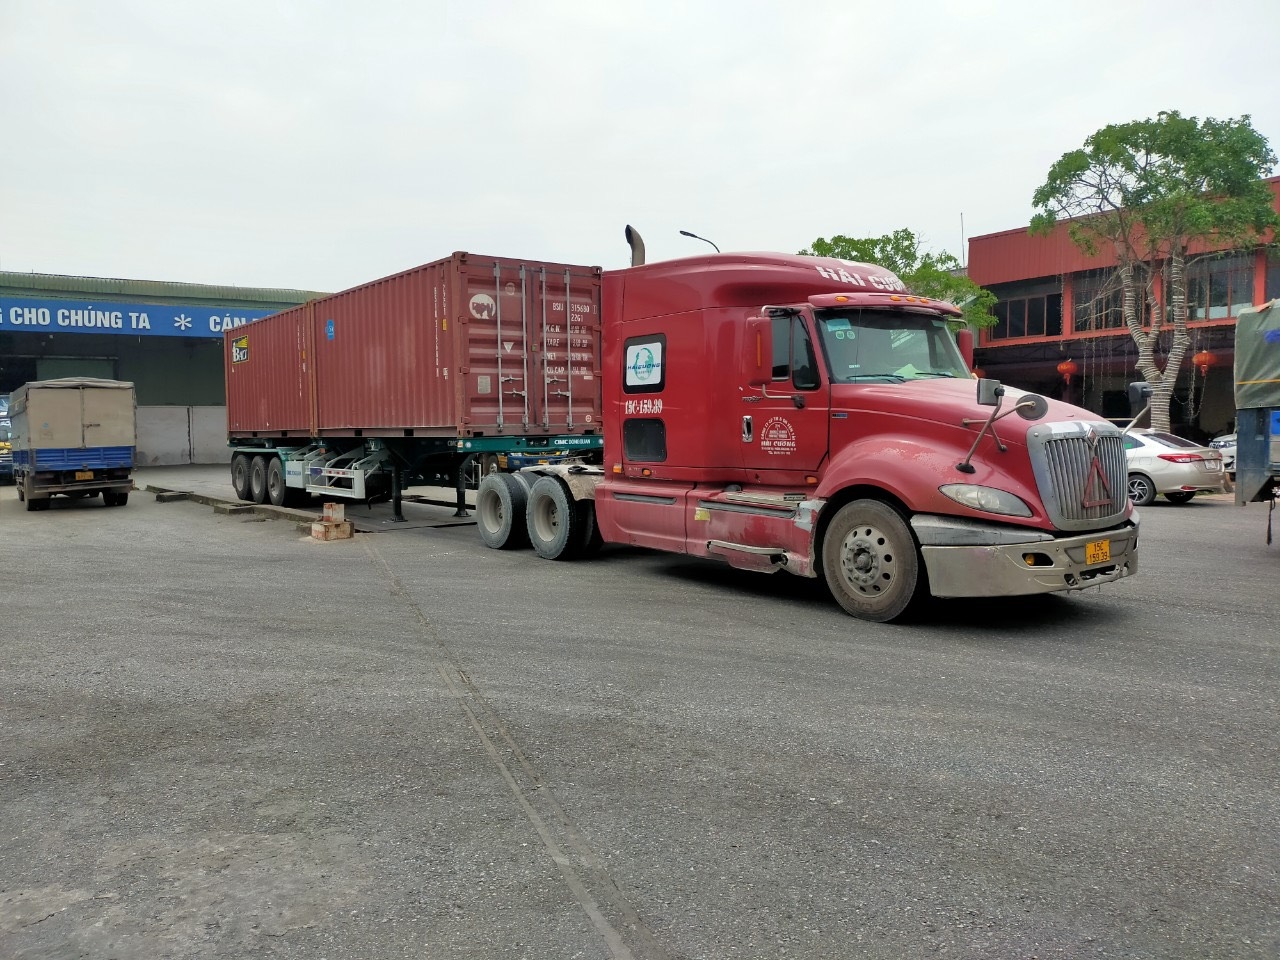
Vận chuyển hàng hóa bằng container rất khác so với phương pháp vận chuyển hàng hóa theo cách truyền thống. Vậy cụ thể vận chuyển hàng hóa bằng container bao gồm những loại nào? Đặc điểm của mỗi loại là gì? Trách nhiệm của người gửi hàng (shipper), người chuyên chở (carrier) và người nhận hàng là gì? Hãy đọc bài viết sau của Hai Cuong Transport để hiểu rõ hơn nhé!
What are Customs Formalites? The process of making customs formalities for imported goods